Tags : technical analysis
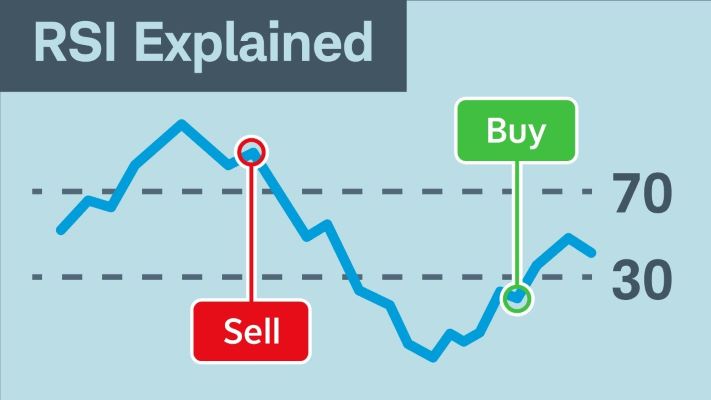
Team L&M The Relative Strength Index (RSI) is a popular technical analysis tool that helps traders assess whether a stock is overbought or oversold. Having an idea of what RSI is and how to implement it can help traders make good decisions. In this article, we shall examine what an RSI below 30 indicates, how […]Read More
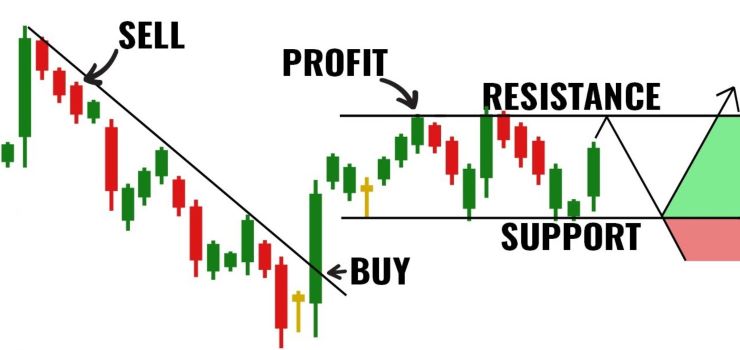
Team L&M Candlestick patterns are rooted in centuries-old Japanese technical analysis. It represents price movements on a candlestick chart. Each ‘candlestick’ symbolises the price action of a security, currency, or derivative for a specific period. In this article, we will cover the top 5 candlestick patterns for becoming a pro trader. 5 Best Candlestick Patterns […]Read More