


Team L&M
The Relative Strength Index (RSI) is a popular technical analysis tool that helps traders assess whether a stock is overbought or oversold.
Having an idea of what RSI is and how to implement it can help traders make good decisions. In this article, we shall examine what an RSI below 30 indicates, how to identify them, and the risks involved in trading based on this indicator.
What Does an RSI Below 30 Indicate?
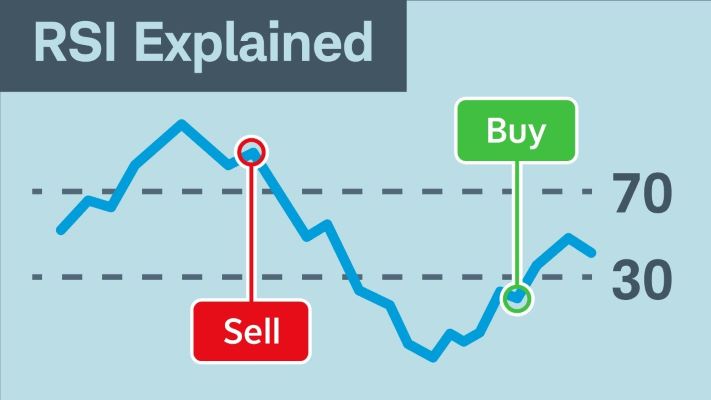
An RSI (Relative Strength Index) of less than 30 usually shows that a stock is oversold and implies that it has been undervalued. This happens in cases where selling has exceedingly overwhelmed buying, often causing the stock value to fall.
An RSI reading below 30 indicates that a stock may be undervalued and could present a buying opportunity.
However, it’s essential to note that an RSI below 30 stocks doesn’t guarantee a price increase; the stock could continue to decline further if negative market conditions persist.
Thus, additional analysis and indicators are crucial for making informed trading decisions.
Identifying Stocks with RSI Below 30
To identify stocks with an RSI below 30, you can follow these simple steps:
1. Use a Stock Screener
A stock screener is a tool that assists you in narrowing down the list of stocks based on some parameters such as RSI, price, market cap, etc.
For example, the ScanX Stock Screener can help you sort stocks based on technical indicators, which include RSI as well. You can input parameters like RSI below 30 to get a list of stocks that meet this criterion.
Stock screeners save time and provide a focused list of potential trading opportunities based on your requirements.
2. Set RSI Filter
In step 2, you need to apply an RSI filter to find stocks with an RSI below 30.
RSI measures how quickly stock prices change, and an RSI below 30 often signals that a stock may be oversold, meaning it could be undervalued. Most stock screener tools allow you to add this filter easily.
Just look for the option to set the RSI value, type in “30,” and the tool will show you stocks that meet this condition.
3. Select the Time Frame
Selecting the time frame for RSI is crucial as it determines the period over which the stock’s price movement is analyzed.
Typically, a 14-day RSI is used, which means the stock’s price over the past 14 days is assessed for overbought or oversold conditions. You can adjust this time frame to shorter (e.g., 7 days) for quicker signals or longer (e.g., 30 days) for a broader view.
Shorter periods provide faster signals but may be less accurate.
4. Review the Results
After applying the RSI filter in the stock screener, a list of stocks with an RSI below 30 will appear.
These stocks are considered oversold, meaning their price has fallen significantly in the short term and may bounce back. However, not all oversold stocks will rise, so it’s important to research each stock further.
Look into the company’s fundamentals, news, and overall market conditions before deciding to invest.
Risk Associated
Using the RSI as an indicator comes with certain risks, including:
- False Signals: An RSI below 30 may signal an oversold condition, but the stock can remain oversold for an extended period without a price recovery.
- Market Trends: In strong downtrends, RSI may remain low and not necessarily indicate a buying opportunity.
- Overreliance: Relying solely on RSI can be risky, as it doesn’t consider other factors like company fundamentals or broader market conditions.
- Short-Term Focus: RSI is a momentum indicator and may not reflect long-term value, making it more suitable for short-term trading.
Always combine RSI with other indicators and research for a balanced analysis.
Conclusion
Stocks with an RSI below 30 can signal potential buying opportunities, indicating that they may be undervalued. However, it’s essential to consider additional factors and analysis to make informed investment decisions.
Using a demat account app can streamline the process of tracking these stocks and executing trades quickly.
