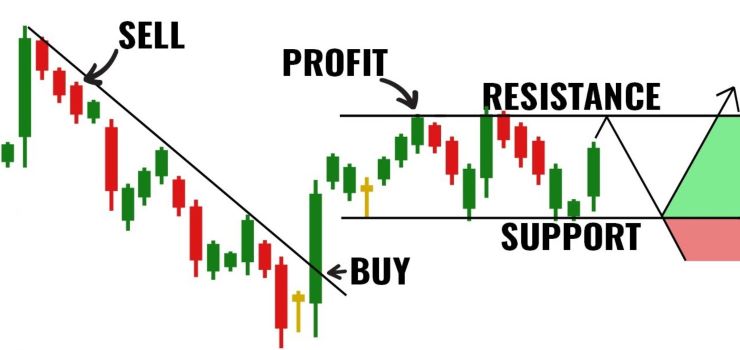
Top 5 Candlestick patterns to become a pro trader

Team L&M
Candlestick patterns are rooted in centuries-old Japanese technical analysis. It represents price movements on a candlestick chart. Each ‘candlestick’ symbolises the price action of a security, currency, or derivative for a specific period. In this article, we will cover the top 5 candlestick patterns for becoming a pro trader.
5 Best Candlestick Patterns
A candlestick pattern comprises the opening, high, low, and closing prices. If the opening price is less than the closing price, the candlestick is typically hollow or green, indicating a price increase. Conversely, if the opening price is higher, the candlestick is filled or red, signaling a price decrease.
Now that you know the basics, let’s understand the best candlestick patterns to help you learn stock market technical analysis and become a pro-trader.
1. Spinning Top
A small real body between long upper and lower shadows defines this pattern. This indicates market indecision. That means neither buyers or sellers gain a decisive advantage. This results in a close near the open price.
The pattern often appears during periods of low trading volume to reflect uncertainty and the potential for a trend reversal. If followed by a confirming candlestick, it may indicate a shift in market sentiment.
However, without confirmation, it suggests continued consolidation and range-bound movement.
2. Doji
It is a cross-shaped formation that occurs during an uptrend or downtrend in security prices. Its opening and closing prices are virtually equal, resulting in a candlestick with a small or non-existent body.
The three major types of Doji patterns you need to know are:
- Long-Legged Doji: This pattern has extended shadows to suggest significant volatility and indecision.
- Gravestone Doji: The open and close prices are at the low end of the trading range, signalling a potential bearish reversal.
- Dragonfly Doji: The open and close prices are at the high end of the range, hinting at a potential bullish reversal.
3. Body Piercing
The piercing pattern consists of two candlesticks. The first candle is a long, bearish candle representing strong selling pressure. The second candle opens below the previous candle’s low and closes above the midpoint of the first candle’s body.
The piercing pattern suggests that buyers are gaining control after a period of bearish dominance. This pattern is more reliable after a prolonged downturn and near key support levels or trendlines.
4. Three Black Crows
The piercing pattern consists of two candlesticks. The first candle is a long, bearish candle representing intense selling pressure. The second candle opens below the preceding candle’s low and closes above the midpoint of the first candle’s body.
The piercing pattern suggests that buyers are gaining control after a period of bearish dominance.
This pattern is more reliable after a prolonged downturn and near key support levels or trendlines.
5. Marubozu
The Marubozu candlestick signals strong conviction among traders. It is characterised by a long body with little to no wicks, which indicates that the opening and closing prices are near the extremes of the period’s high and low.
A White Marubozu forms when the open is low and the close is high, reflecting strong buying pressure throughout the session. Conversely, a Black Marubozu occurs when the open and the close are high, showing dominant selling pressure.
The absence of shadows implies that market sentiment is overwhelmingly in favour of the trend’s direction, whether upward or downward, and can often precede continued movement in the same direction.
Conclusion
Mastering candlestick patterns is essential for trading proficiency. Recognising these patterns can help you capitalise on market movements. To learn more about these patterns, consider enrolling in Upsurge.club’s technical analyst course.

